
The snow begins to fall. For students, parents, and teachers, a single thought crystallizes: will there be school tomorrow? In the past, this meant waiting by the radio or television for the morning news. Today, many turn to a different kind of oracle: the snow day calculator. These online tools promise to predict the future, offering a percentage chance of a coveted day off. But how accurate are they? Can you really trust that 90% prediction?
As a technology analyst and writer, my job is to look under the hood of the digital tools that shape our lives. My name is Wisam Saddique, and I’ve spent years analyzing how algorithms—from simple apps to complex predictive models—translate data into answers. When my own children started showing me these calculators with the earnestness of a meteorologist, I had to investigate. What, exactly, are these tools measuring?
What I found is that the answer to “how accurate are they?” is far more complex than a simple “yes” or “no.” This article will provide a substantial, complete description of how snow day calculators work, what data they use, their surprising limitations, and how you can use them as a smart, informed user rather than a hopeful gambler.
What is a Snow Day Calculator?
At its core, a snow day calculator is a predictive algorithm that attempts to quantify the probability of a school closing due to winter weather. The user typically provides a single piece of information: their zip code. The calculator then fetches data and runs it through its internal model to output a “chance of a snow day,” almost always as a percentage.
It is crucial to understand what these tools are not. They are not an official source of information. They have no direct line to your school superintendent’s office. The prediction you see is a third-party, non-binding estimation based on publicly available data.
While they may seem like simple fun, the more sophisticated calculators are a great example of data aggregation—the process of gathering information from multiple sources and presenting it in a unified way. The “magic” isn’t in a crystal ball; it’s in an API.
How Snow Day Calculators Form Their Prediction
To understand a calculator’s accuracy, we must first understand its “brain.” The algorithm relies almost entirely on automated data inputs. When you enter your zip code, the calculator is programmed to “call” or “ping” several public data sources to get the forecast for your specific area.
The Algorithmic Inputs (What the Computer Sees)
A calculator’s prediction is only as good as the data it’s fed. Here are the primary “ingredients” that go into its formula.
- Public Weather Data: The most important input. The calculator’s script pulls data from public Application Programming Interfaces (APIs), most commonly from the National Weather Service (NWS).
- Key Weather Metrics: The algorithm isn’t just looking for “snow.” It is programmed to search for specific, quantifiable data points in the forecast, including:
- Snowfall Accumulation: The total number of inches predicted.
- Timing of Snowfall: This is a critical variable. A forecast of 6 inches falling between 10 PM and 4 AM is far more likely to trigger a closing than 6 inches falling between 9 AM and 5 PM.
- Temperature and Wind Chill: The model checks for “danger” thresholds.
- Precipitation Type: The model must distinguish between light snow, heavy snow, and, most importantly, ice and sleet.
- Government-Issued Alerts: A good calculator will weigh official NWS alerts heavily. A Winter Storm Warning or Blizzard Warning will send the probability percentage soaring, while a Winter Storm Watch or Advisory will raise it, but less dramatically.
Some more advanced calculators may attempt to factor in historical data—for instance, trying to “learn” if your specific school district is notoriously quick to close or if it takes a major storm to shut things down. However, this is difficult to maintain and often unreliable.
The Great Divide: Why the “Prediction” Fails
Here is the central truth of snow day calculators: They are predicting the weather, but a human is making the decision. The calculator’s algorithm and your school superintendent’s decision-making process are two completely different things. The calculator’s biggest inaccuracies don’t come from a bad weather forecast, but from its total inability to understand the “ground truth” of a school district.
A calculator “thinks” 8 inches of snow is a 95% chance of closing. A superintendent “thinks” about a thousand other variables.
The “Ground Truth”: What Your Superintendent Actually Considers
I’ve analyzed numerous school district policies, and their decision-making criteria are almost exclusively focused on logistics and safety, not just weather.
1. Safety and Logistics (The Bus Problem)
The number one factor is not the amount of snow; it’s the ability of a school bus to safely complete its route. This includes:
- Road Conditions: Are the main and residential side streets plowed? A superintendent is in contact with local road crews, sometimes as early as 4 AM, to get a real-time report.
- Bus Fleet: Can the buses themselves start in the extreme cold? Is the diesel fuel gelled?
- Student Safety: Can children safely walk to their bus stop or school? Can they wait at the bus stop for 10-15 minutes without risk of frostbite? This is where wind chill becomes a primary factor.
2. The Ice vs. Snow Problem
Most calculators are overly focused on snowfall totals. In reality, most superintendents fear ice far more. A forecast of 4 inches of fluffy snow is a “maybe.” A forecast for a quarter-inch of freezing rain is a near-certain closure. Ice makes all roads, sidewalks, and parking lots unsafe, period.
3. The Extreme Cold Factor
This is a variable many calculators handle poorly. A forecast for a clear but bitterly cold day might get a 0% on a calculator. However, many school districts have a firm “wind chill” threshold. For example, some districts in the Midwest will publicly state that if the NWS-predicted wind chill is -20°F to -25°F or colder, they will begin discussions to close, even if there is no snow. This is purely to protect children at bus stops.
4. Infrastructure and Staffing
The calculation also includes factors an algorithm could never know:
- School Buildings: Do the school buildings have power and heat? A storm that knocks out power will close a school, even if the roads are clear.
- Staff Availability: Can teachers, administrators, and critical staff (especially bus drivers) physically and safely get to work? If a large portion of the staff is snowed-in, the school cannot operate.
5. The Timing Element
The superintendent’s decision is often made in a very small window, typically between 4:30 AM and 5:30 AM, to get the word out before the first buses roll. A forecast that changes dramatically at 3 AM will inform their decision. A calculator’s prediction from 10 PM the night before is based on old data.
A Realistic Look at Accuracy (The 80/60 Rule)
So, how accurate are they? Based on this divide, we can establish a general rule of thumb for interpreting their predictions.
- High Confidence (80% – 99%): At this level, the calculator is likely accurate. This is because the reason for the high prediction is a major, undeniable weather event (e.g., a Blizzard Warning, 10+ inches of snow). In this scenario, the algorithm’s data and the superintendent’s reality are aligned. Both see a clear safety hazard.
- Low Confidence (0% – 60%): Treat this as a “coin toss” or, more accurately, a “no.” This is the “gray area” where the calculator’s limitations are most exposed. A 45% chance for 3-5 inches of snow means the algorithm sees a “maybe.” But this is precisely where the superintendent’s “human factors”—ice, timing, bus safety—will override the simple snowfall total.
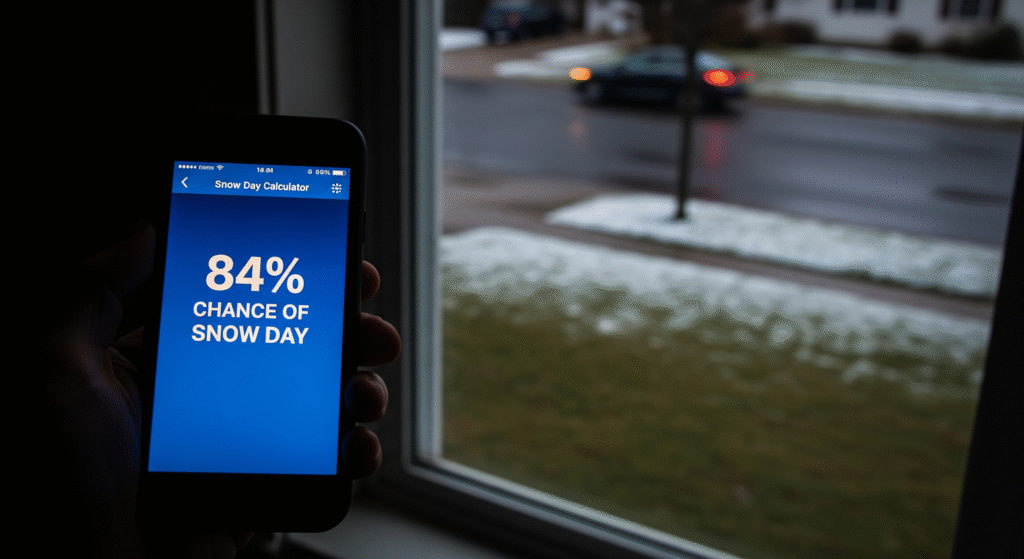
- The 84% Fail: There are countless stories of a calculator showing 84%, only for school to be open. This is the classic example. The forecast may have been for 6 inches (which the algorithm loves), but the actual result was 3 inches of slush, or the snow stopped by 3 AM, giving plows ample time to clear the roads. The algorithm saw the forecast; the superintendent saw the reality.
Snow Day Calculator vs. School Superintendent
To make this clear, here is a direct comparison of the two “brains” making the decision.
| Factor | Snow Day Calculator (Algorithm) | School Superintendent (Human) |
| Data Source | Public NWS weather data (forecasts) | NWS forecasts + real-time reports from local road crews, bus depots, and police. |
| Key Question | “How many inches of snow will fall?” | “Can our buses run safely at 6 AM?” |
| Ice vs. Snow | Often treats all precipitation as a simple data point. | Weighs 1 inch of ice as a far greater threat than 6 inches of powder snow. |
| Wind Chill | May factor it in, but its weight is unclear. | Has a firm threshold (e.g., -25°F) that can trigger a closing on its own. |
| Timing | Looks at the 24-hour forecast. | Hyper-focused on the 4 AM – 7 AM window. |
| Final Decision | A probability percentage based on a formula. | A “Go/No-Go” decision based on student safety and logistics. |
How to Use a Snow Day Calculator Like an Expert
You don’t have to delete your bookmark. You just need to change how you use the tool. Use it like a true analyst: as one data point, not as the final answer.
Step 1: See It as a Weather Dashboard
The real value of a good snow day calculator is its ability to aggregate data. When you check it, don’t just look at the percentage. Look at the data it’s showing you:
- Is there a Winter Storm Warning?
- How many inches is it really forecasting?
- What is the wind chill?
Think of it as a quick-glance dashboard for the official NWS forecast, not as a crystal ball.
Step 2: Always Check the Primary Sources
The calculator is a secondary source. An expert always goes to the primary source.
- Source 1: The National Weather Service (NWS): This is where the calculator gets its data. You can get it, too. Go directly to https://www.weather.gov/ and enter your zip code. Look for the “Hazardous Weather Outlook” or any active warnings. Their forecast is the most reliable one available.
- Source 2: Your School District: This is the only source of truth for the decision. Check the official district website, the official X (formerly Twitter) account, or whatever text/email alert system your district uses. This is the final word.
Step 3: Learn Your District’s “Snow Personality”
Finally, add your own human experience. In my own district, I’ve learned that our superintendent is far more concerned with ice than snow. A calculator might show a 30% chance for a light dusting, but I know if the forecast mentions “glaze” or “freezing rain,” the actual chance is much higher than the algorithm can capture.
Does your district close for 3 inches? Or does it take 8+? Does extreme cold send out the alert? This local knowledge, combined with the primary NWS data, will give you a far more accurate prediction than any online tool.
Frequently Asked Questions (FAQs)
- Why did the calculator say 99% and my school stayed open?This almost always means the forecast was a “bust.” The algorithm was likely reacting to a “Blizzard Warning” or a “12-inch” forecast that never materialized. The superintendent saw the 2 inches of slush on the ground at 5 AM and made the call to open.
- What’s more important for a snow day: snow or ice?For a superintendent, almost always ice. Freezing rain or a “glaze” of ice can make roads and sidewalks impassable, even in small amounts. Heavy, fluffy snow is often easier for plows to manage.
- What about extreme cold?Extreme cold is a major, and often overlooked, factor. Many districts have a specific wind chill (e.g., -20°F or -25°F) that will close schools to protect children from frostbite at bus stops, even with clear skies.
- Where can I find the official school closing information?Check your school district’s official website. They will have a page detailing their weather closure policy and will list their official communication channels (e.g., text alerts, social media, local news). This is the only source that matters.
Conclusion
Snow day calculators are brilliant and fun pieces of code. They are excellent at doing what they were designed to do: read a weather forecast and make an educated guess based on a formula.
Their “inaccuracy” comes from our own misunderstanding of what they are measuring. They cannot predict the “human factor”—the complex, logistical, and safety-based decision that a real person in your school district’s office has to make at 5 AM.
So, by all means, check the calculator. But treat it as the start of your research, not the end. Use it as a dashboard to see the NWS data, and then check your school’s official announcement for the final, authoritative answer.


